Emission lines are very easy to produce in a laboratory, which is one reason I am presenting them for my project. In the outside world, emissions are produced by street lamps, neon signs and florescent bulbs. In the wonderful world of space, nebulae and some stars can radiate emission lines as well.
Example:
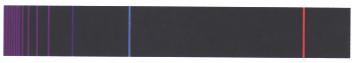
Hydrogen emission lines are radiated by a hot, thin hydrogen gas, and appear at the same wavelengths as the hydrogen absorption lines.
From "Astronomy! A Brief Edition," J. B. Kaler, Addison-Wesley, 1997.
Interesting Find: Whilst looking around the internet for helpful information, I found this great simulation made by (I think) the University of Oregon. It allows you to look at the specific emission and absorption lines for every element on the periodic table and the corresponding wavelengths of each line.
No comments:
Post a Comment